


Clustering is a set of methods to group objects into homogeneous classes. A cluster is a set of objects that have similarities among them and that have dissimilarities with objects in other clusters. The input of a clustering algorithm is made from a sample of elements, while the output is given by a number of clusters in which the elements of the sample are divided according to a similarity measure. The clustering algorithms provide the description of the characteristics of each cluster as output as well.
Cluster analysis is used in many areas:
- Market research.
- Pattern recognition.
- Grouping of customers based on purchasing behaviour (market segmentation).
- Positioning of the products.
- Analysis of social networks, for the recognition of users’ communities.
- Identification of outliers. Outliers are abnormal values that differ greatly with all other elements of the data set. Their identification can be interesting for two reasons: the elimination of these outliers, which may be caused by errors, or the isolation of these particular cases that might be of importance to the business.
Clustering algorithms fall into two main categories:
- Hierarchical clustering algorithms
- Partition clustering algorithms
The former organize data in nested sequences of groups that we could represent as a tree structure. The partition clustering algorithms, instead, determine the partitioning of the data into clusters so as to reduce the dispersion within a single cluster as much as possible and, conversely, to increase the dispersion between clusters. This is not in this case with hierarchical algorithms since the clusters are all at the same level of partitioning. The partition clustering algorithms are more suitable for very large data sets, for which the construction of a hierarchical structure of the clusters would result in very high computational effort. Therefore, in the remainder of the post we will deal with this technique in more detail.
The measure of similarity between an element and another can be calculated via different methods.
There are many similarity measures, among which the Minkowski distance, the Simple Matching Coefficient, the Jaccard coefficient, the Pearson’s correlation.
One of the simplest is the Euclidean distance between two points in an n-dimensional space. Its formula is:
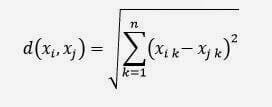
where:
xi and xj are two elements of the data set represented by vectors. E.g. .: xi = {xi1, xi2, …, xin}. n is the number of dimensions.
The formula is valid for continuous variables, while for Boolean values (true/false) or categorical variables (e.g. The colour may be green, white, red, etc.) we can use a different formula:
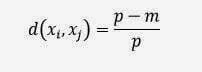
p is the number of Boolean or categorical attributes
m is the number of attributes with the same value between xi and xjThe agglomerative hierarchical clustering uses the following algorithm for cluster identification:
- Initially, each element of the data set forms a separate cluster
- Similar clusters are combines at each iteration, gradually expanding the similarity threshold
- The iteration ends when all the objects are grouped into a single cluster, where all elements are considered similar.
The formation of clusters is represented by a dendrogram or tree chart, as shown below:
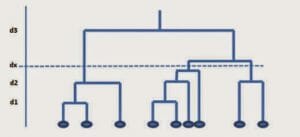
The cutting point of the tree, defined by the user and represented in the graph by the value of distance dx, determines the number of clusters. The algorithm is accurate but it is not very efficient from the calculation point of view. Also it does not provide for a reallocation of the components in the clusters during iteration.
Now let’s see how the partition clustering works. First, you must determine how many clusters you want to have and we indicate this number with K. The procedure is as follows:
1) PWe partition the mix K cluster, assigning to each one elements chosen randomly.
2) We calculate the centroid of each cluster k with the following formula:
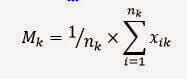
Mk is the mean vector, or centroid for the cluster k
nk is the number of elements in the cluster k
xik is the i-th element of the cluster3) We calculate the distance of the elements of the cluster from the centroid, obtaining a square error, and using the formula:
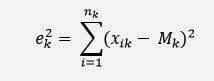
k2 is the square error for the cluster k
xik is the i-th element of the cluster
nk is the number of elements in the cluster k
Mk is the mean vector, or centroid for the cluster kThe sum of the errors of all cluster provides the total error for the partition which represents the value to be minimized.4) At this point we reassign the elements of the sample according to the nearest centroid.
5) Repeat the steps 2, 3, and 4 until the minimum value of the total error has not been reached, or until the cluster members do not stabilize.
The algorithm, called K-means, is sensitive to the allocation of initial values and, according to it, may converge to a local minimum of the error function and not to the absolute minimum. It is also very sensitive to data noise and to the presence of outliers. The variant K-mediods, which uses the most central object (mediod) instead of the average of the cluster’s elements, is less affected by the presence of data noise and outliers.
Bibliography:
A. Rezzani, Business Intelligence. Processi, metodi, utilizzo in azienda, APOGEO, 2012
Mehmed Kantardzic Data Mining: Concepts, Models, Methods, and Algorithms, John Wiley & Sons, 2003
Jiawei Han, Micheline Kamber, Data Mining:Concepts and Techniques Second Edition, Morgan Kaufmann Publishers, 2006
Comments are closed.